
Semrush Sensor is a tool that helps you track volatility in search results, tracking down 20+ categories on mobile and desktop and highlighting possible Google Updates.
Here are the steps on how to know if your website industry is affected by Google Algorithm Updates with SEMRUSH Sensor:
Step 1: Go to the Semrush Sensor page and sign in to your account

Step 2: Select the category that you want to track. You can track up to 20 categories
(Choose category according to your business industry)

Step 3: Choose Search Engine Country Servers(notes: Now only 8 Countries available for Google)

Step 4: Click on featured snippet

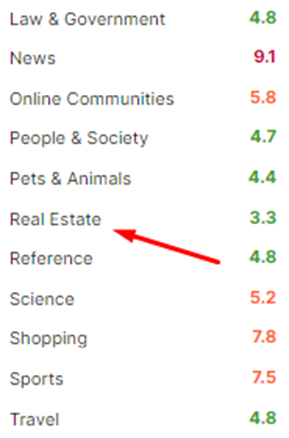
Step 5: Analise the Desktop SERP volatilities according to Google algorithm update

Analise the Desktop SERP volatilities according to Google algorithm update

Analysis: Desktop and Mobile score is different, here we can understand that on which version of SERP are changing more(Desktop/Mobile), so that we have to optimize our website accordingly.
Ando also have an idea about featured snippets performance behaviour according to algorithm changes.

There are 4 types of scoring signals:
· Blue represents the lowest SERP visibility changes on a particular business category
· Green (Normal) represents the natural SERP changes
· Orange (High) denotes some major changes in SERP visibility.
· Red(Very High) denotes that the particular industry is highly affected by SERP volatility (Maybe for some core updates)
And depending on numbers (like 3.2, 3.4 we have seen above screenshots) these signals are flagged to the business category or industry type.
We can analyse any of the SERP features by clicking on the different listings highlighted in below screenshot

From this analysis we can find latest SERP feature trend, so that we can implement and optimize our website with schema mark ups for trending SERP features. It can give a boost to website ranking.
Step 6: Monthly basis deviation Analysis:
>>Click on Deviation tab on the top

In the “Deviations” tab, you can look for specific days where volatility was out of the ordinary. The graph measures each day’s deviation compared to the monthly average so you can tell which days in the past month saw the most or least amount of change. It can also help you understand which industries were most impacted by an update.
The average deviation across all categories will be listed first in the list and the categories with the most deviation from the average will be listed next in bold text. Keep in mind that the deviations are all relative to the day that you have selected at the top of the page.

To hone in on a specific industry, you can select the category from the left menu and the graph will show that category’s daily deviation from its average. Here We have analysed for Real Estate Industry.

Step 7: Analyse top winners in SERP after changing google algorithm
>>Click on Winners and Losers tab on the top


Analysing the top winners and losers, we have listed out the competitor’s who are winning in Google ranking factor. So we can analyse their implementation on the websites to improve ours. And also analyse the losing competitor for pointing out their mistakes to prevent our website.
Conclusion:
1. We have got the clear idea about the recent SERP volatility.
2. We can find out if our business industry has been affected by the algorithm update.
3. Listing out recent competitor’s who are ruling on SERP.